cat ~/notes/ulimit-docker-janus.md
ulimit in docker: when a janus sfu runs out of file descriptors
[id]ulimit in docker: when a janus sfu runs out of file descriptors
We spin up containers with whatever defaults come in the box. The point is just to get the thing running.
RAM, CPU, the little limits… we do not really think about them, because the VM already feels big enough.
But over time problems show up, sometimes triggered by something external, like a sudden spike in traffic.
And yes, I lived this one. Enough that I had forgotten there is such a thing as ulimit… because I run docker, and it keeps that out of sight.
And it all started here.
Outgoing audio and video calls on janus suddenly started dropping in bulk one morning.
The API dashboard showed incoming traffic tripling, but the median call duration collapsed. The culprit was not memory, CPU, or network… it was the default file descriptor ceiling in docker that nobody had ever tuned.
client: “hey, how come i can’t make a call?”
That was the message that reached me that morning. Not an alert, not a dashboard gone red… the client, directly.
And that is when it hit me, the uncomfortable part: there was no alert watching this service at all. If it went down, nothing shouted. The first one to notice something was broken was the client.
I looked, and it was true… a wave of calls cutting out mid-conversation, all around the same time, on an otherwise normal morning.
The dashboards contradicted each other. Incoming API traffic had roughly tripled, but median call length had dropped by half. More calls, each one shorter in duration.
The first read was a traffic spike, so I scaled the API out. But the API was never the problem… 5xx flat at 0.0%, p99 around 75 ms, every response a clean 200. The traffic was real, but it was a symptom of something upstream.
So what does the SFU actually do?
The system is a single janus process running as an SFU. Why an SFU rather than mesh or P2P, I wrote up in an earlier janus post. Every call is 1:1, but the media still flows through the server… clients send RTP to janus, janus relays it to the other side. Each call is recorded server-side, and clients auto-retry the moment a call drops.
janus runs as a standalone container with --network host, for the large range of UDP ports RTP needs. Restart policy is unless-stopped, so if it dies, docker brings it right back.
Two behaviors matter here: clients auto-retry (set up a fresh call) on drop, and docker restarts the container on process exit.
A step change, not a gradual trend
If calls were dropping, the media path was where to look, not the API. And the media resources were all fine: ~46 Mbps egress against a much larger ceiling, janus at ~80% of one core, gigabytes of memory free, disk at 35%. Nothing there explained a call dying mid-flight.
So I looked at when it started. Bucketed by half hour, the morning had a clean break… healthy calls with a 4-5 minute average, then in a single 30-minute bucket the average length collapsed.
A resource running out slowly shows up as a gradual trend in the time series. This was not that… the metric was a step change, a jump at a single point in time. That means an event, not gradual degradation.
The event was in the janus logs:
Initializing ICE stuff (Lite mode...)That line prints once, when janus starts. It was printing every 90 seconds.
janus was not serving calls. It was restarting, over and over. And every restart took every live call down with it.
Why janus kept dying
The kernel had the cause:
traps: janus[...] trap int3 ... in libglib-2.0.so.0.7400.6int3 is a software breakpoint… a SIGTRAP. glib raises it from g_error(), its fatal path. Something in glib had hit an error it could not recover from and pulled the whole process down.
The janus log named it:
GLib-ERROR: Creating pipes for GWakeup: Too many open files
record.c ... fopen error: 24
errno 24 is EMFILE, too many open files. janus could not even open a recording file. It had run out of file descriptors.
And there it was… the ulimit I had forgotten:
cat /proc/$(pgrep -x janus)/limits | grep 'open files'
# Max open files 1024 ...- The old linux default, inherited by the container because nobody set otherwise. And a WebRTC SFU is a file descriptor machine… every call opens UDP sockets for RTP and RTCP, eventfds for the glib main loop, and a handle per recording. A few hundred simultaneous calls and janus was already close to the wall.
OOMKilled was false the whole time. It was never memory. It was file descriptors.
The storm explains itself
This is where the contradictory dashboard resolves.
Every crash tore down every active WebRTC session. And the client is built to auto-retry: the moment its session drops, it tries to set up a new call from scratch… fresh signaling, another room join on the SFU, another ICE/DTLS handshake. That wave of re-initiations hit a janus climbing back toward the same FD limit, so it crossed again and crashed again, roughly every 90 seconds.
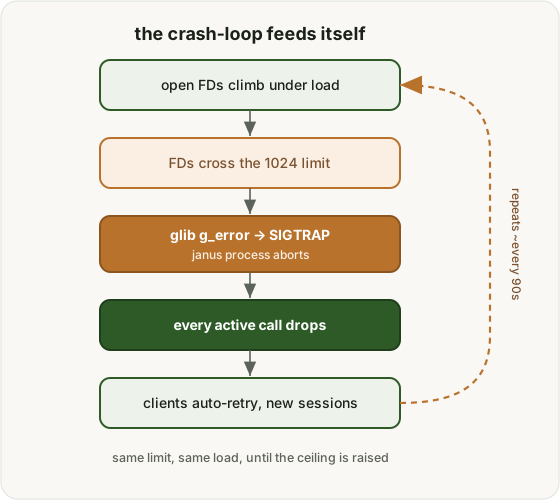
The database showed the shape of it. Compared to a normal morning, the number of distinct callers barely moved… but the average calls per caller roughly doubled.
Not new users arriving. The same callers, auto-retrying into a crash-loop. That is what drove the API traffic up… each retry a full call-signaling cycle, from setup to teardown.
Every alarming number that morning traced back to one process running out of file descriptors.
Raising the ceiling
The fix is one flag on the container:
docker run -d --name janus --network host --restart unless-stopped \
  --ulimit nofile=1048576:1048576 \
  janus-image
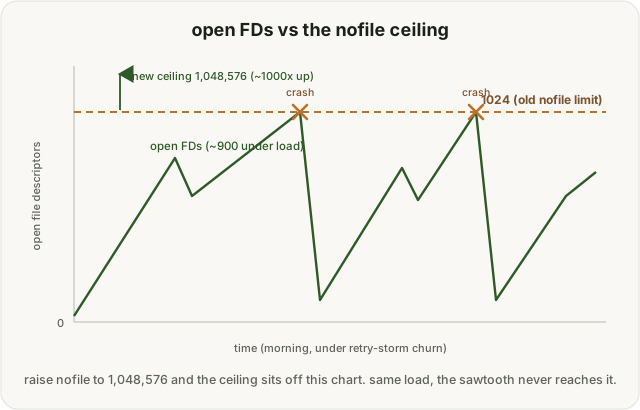
nofile is the open-file limit, soft and hard. It is a runtime flag… no image rebuild, nothing else redeployed. A ulimit cannot change on a running process, so janus has to be recreated to pick it up. That drops the calls in flight once, a fair trade against a crash every 90 seconds.
Then verify against the original failure, not the deploy:
cat /proc/$(pgrep -x janus)/limits | grep 'open files'
# Max open files   1048576 ...
docker inspect janus --format '{{.RestartCount}}'
# 0, and staying 0
Zero restarts over the next hours, no new int3 in the kernel log, the recording backlog drained, call length back to normal.
The most convincing number was the open descriptor count under afternoon load: around 900. With the old limit of 1024, janus had been living a few hundred descriptors from death. That is why it only broke under load, and why it broke so suddenly once it crossed.
ulimit overhead, and where the config lives
Nothing you can feel. nofile is a ceiling, not a reservation… janus opens only as many descriptors as it needs. Raising it allocates nothing. It just moves the wall far enough that normal load never reaches it.
But the limit lives on the container, not the image. A plain restart keeps it. Recreate the container from an old command without the flag and the ceiling silently drops back to 1024. So the flag belongs in whatever script actually starts the process, not in one lucky container.
And it is worth watching for… so next time the one that shouts is not the client. To catch a recurrence I counted the startup banner straight from the logs, not a container-restart metric:
sum(count_over_time({container="janus"} |~ "Initializing ICE stuff" [10m])) > 3One or two starts in ten minutes is a deploy. More than three is a crash-loop. That line would have fired within ten minutes of the first crash, not the two hours it actually ran.
The limit was there the whole time. It did not change… the load did. That is the thing about defaults nobody set: they are not wrong, until the day something finally reaches them.
The takeaway is straightforward: ulimit (especially nofile) is an OS-level boundary that is easy to overlook when you only monitor CPU and RAM. The moment an application opens thousands of sockets, file handles, or event loop descriptors, the default 1024 ceiling in Linux becomes the first invisible wall that crashes the process without ever triggering an OOM.
If you run high-concurrency networking services inside docker, do not rely on defaults. Check the limits of the live process directly in /proc/<pid>/limits and configure --ulimit nofile explicitly from day one.
If you like these hidden-docker-default stories, there is also postgres /dev/shm too small in swarm.